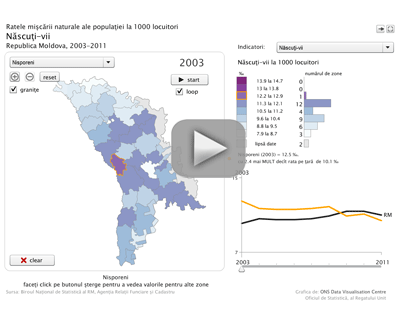
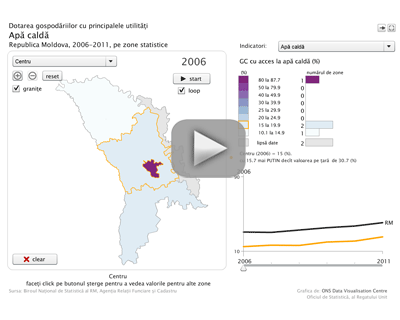
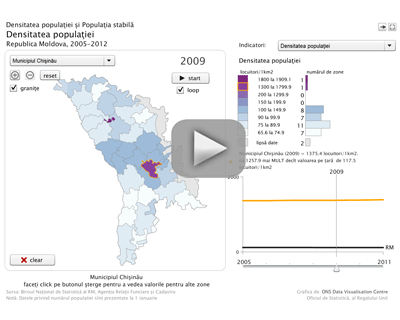
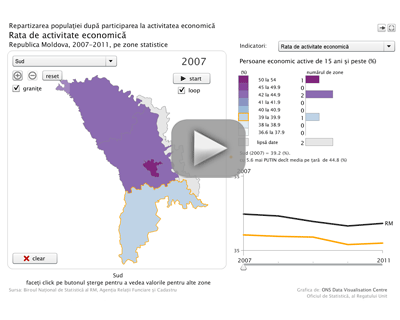
Animated maps
Vital statistics rates, by districts, 2003-2019 | Household amenities, by zones, 2006-2018 |
Population density and resident population count,
| Distribution of population by economic activity,
|
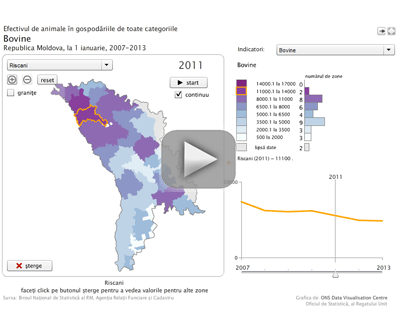
Livestock in all categories of households,
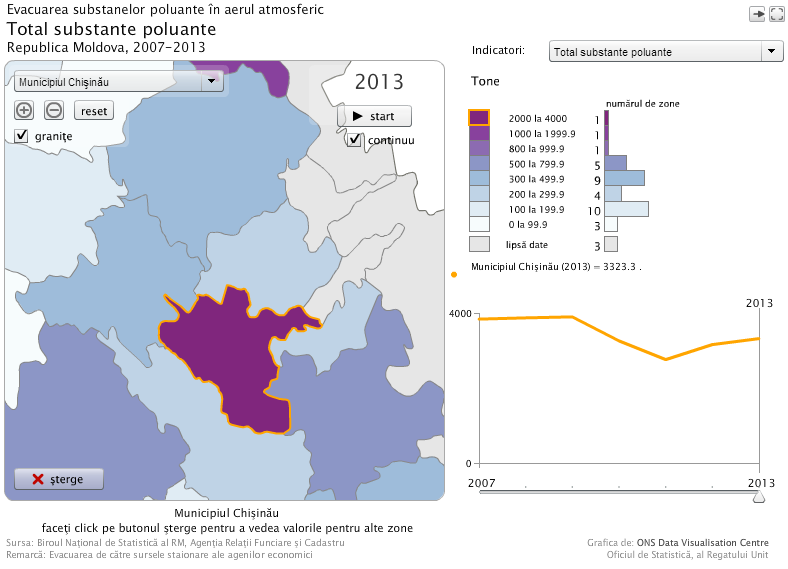
| Emission of polluted substances in atmospheric air,
|