RO RU EN
RSS feed
Updated: 24.05.2013
Home /
Animated graphs in labour force statistics field
Print version
 

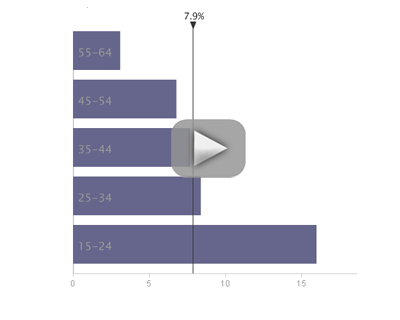
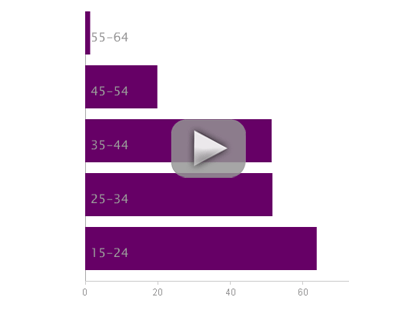
Animated data visualisation using this application presents the changes in quarterly unemployment rate and labour force migration, by age groups, from 2000 to the present.

Applications developed in collaboration with Data Visualisation Centre of United Kingdom’s Office for National Statistics.

Unemployment rate

Labour force migration

Animatie_somaj

Animatie_migratie

Technical specifications: You must have the browser plugin Flash installed in order to view the application.

Methodological notes: Data are presented without the population on districts from the left bank of the river Nistru and municipality Bender.

Useful links


Home Contact Sitemap
 
Press releases  / StatBank  /  Statistics by themes  / Products and services  / Censuses  / Metadata  / IMF's SDDS  / About NBS  / News and events  / Useful links
Up
2136483 visits
 
Copyright © 2013 NATIONAL BUREAU OF STATISTICS OF THE REPUBLIC OF MOLDOVA
All rights reserved.
TRIMARAN - IT Solutions Company // web, interactive, motion and software development solutions // http://www.trimaran.md, B2B and B2C solutions  /  Branding & Graphic Design Services / Website Design and Development  /  E-Commerce Systems / Software Application Architecture and Development / Multimedia solutions  /  2D/3D modeling & animation solutions / Video & Post Production / contact@trimaran.md
Created by Trimaran