
Animated population pyramid
Animated population pyramid
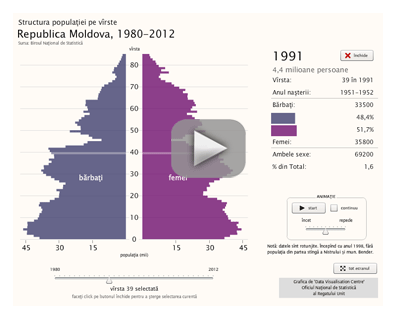 A population pyramid is a graphical illustration of the age and sex structure of the population of the Republic of Moldova beginning with 1980 till present.
Animated visualization of data by using this application allows to observe the changes in the demographic portrait of the population, influenced by annual fluctuations in births and deaths, migration, other exceptional events, as well as indirect causes, such as changes in people’s lifestyle (i.e. in the field of fertility or life expectancy).
The length of individual bar in the chart represents the number of people in the selected age group. The number of men is shown on the left and the number of women on the right.
To see the pyramid, click on the picture. Various options will be described under the pyramid on mouseover.
The application was developed in collaboration with Data Visualisation Centre of United Kingdom’s Office for National Statistics and offered to National Bureau of Statistics of the Republic of Moldova for which we kindly thank them.
Technical specifications for using the pyramid
- You must have the browser plugin Flash installed in order to view the population pyramid.
Methodological notes:
- Resident population represents the number of persons, permanently residents on the given territory, including the persons temporarily absent.
- Beginning with 1998 data are presented without the population on districts from the left bank of the river Nistru and municipality Bender.
Useful links: